Which Texas cities have the steepest home-price declines in 2026?
According to a ranked breakdown published by the YouTube channel The Resident Survivor, ten Texas cities have posted the sharpest peak-to-current home-price declines heading into the back half of 2026. Austin tops the list with a claimed 22% drop from its pandemic-era peak, followed by Georgetown (19%), Pflugerville (18%), Conroe (16%), Galveston (15%), Round Rock and Denton (14% each), McKinney (13%), Midland (11%), and Frisco, which the video describes mainly through price cuts rather than a single percentage figure.
The common threads, per the video, are not just higher mortgage rates. They're a builder-driven supply glut, property-tax bills that haven't caught up to falling values, and investors — both small landlords and larger buyers — unwinding positions in markets that overheated between 2021 and 2023.
That's the creator's framing. Below, we break down the numbers city by city, explain the market mechanics behind them, and flag where the narrative deserves a more measured read.
The ranked list: 10 Texas markets under pressure
The figures below come directly from the video's cited sources — Austin Board of Realtors, Redfin, Zillow, Realtor.com, Texas A&M Real Estate Center, CoreLogic, Texas Department of Insurance, AirDNA, and county-level realtor associations. None of these figures have been independently verified by US Housing Report, so treat them as one analyst's compilation rather than an official index.
| Rank | City | Claimed price decline | Est. equity lost per household | Active listings change | Days on market |
|---|---|---|---|---|---|
| 1 | Austin | 22% | ~$200,000 | +300% (since pandemic lows) | 98 |
| 2 | Round Rock | 14% | ~$90,000 | +210% (stale listings) | 90+ |
| 3 | Conroe | 16% | ~$60,000 | +160% | 92 |
| 4 | Pflugerville | 18% | ~$80,000 | +230% | 110 |
| 5 | Midland | 11% | ~$45,000 | +85% | 95 |
| 6 | Georgetown | 19% | ~$100,000 | +260% | 120+ |
| 7 | Frisco | not given | ~$65,000 (avg. price cut) | +145% | 88 |
| 8 | Galveston | 15% | not given | +60% | not given |
| 9 | Denton | 14% | ~$55,000 | +125% | 85 |
| 10 | McKinney | 13% | ~$75,000 | +130% | 80+ |
A few numbers stand out. Georgetown, which the U.S. Census Bureau has repeatedly named one of the fastest-growing cities in the country in recent years, shows one of the largest reported dollar losses per household in this list — roughly $100,000 — tied to a 260% jump in active inventory as builders kept adding retirement and remote-worker communities.
Austin's 22% figure would be historically large for any major U.S. metro if confirmed across a full data set; the video cites Redfin figures showing over 45% of Austin listings have taken at least one price cut, and Zillow data showing homes sitting on market for about 98 days, well above the roughly 30-45 days considered a balanced market in most cyclical analyses.
What's actually driving the pullback: supply, taxes, and buyer fatigue
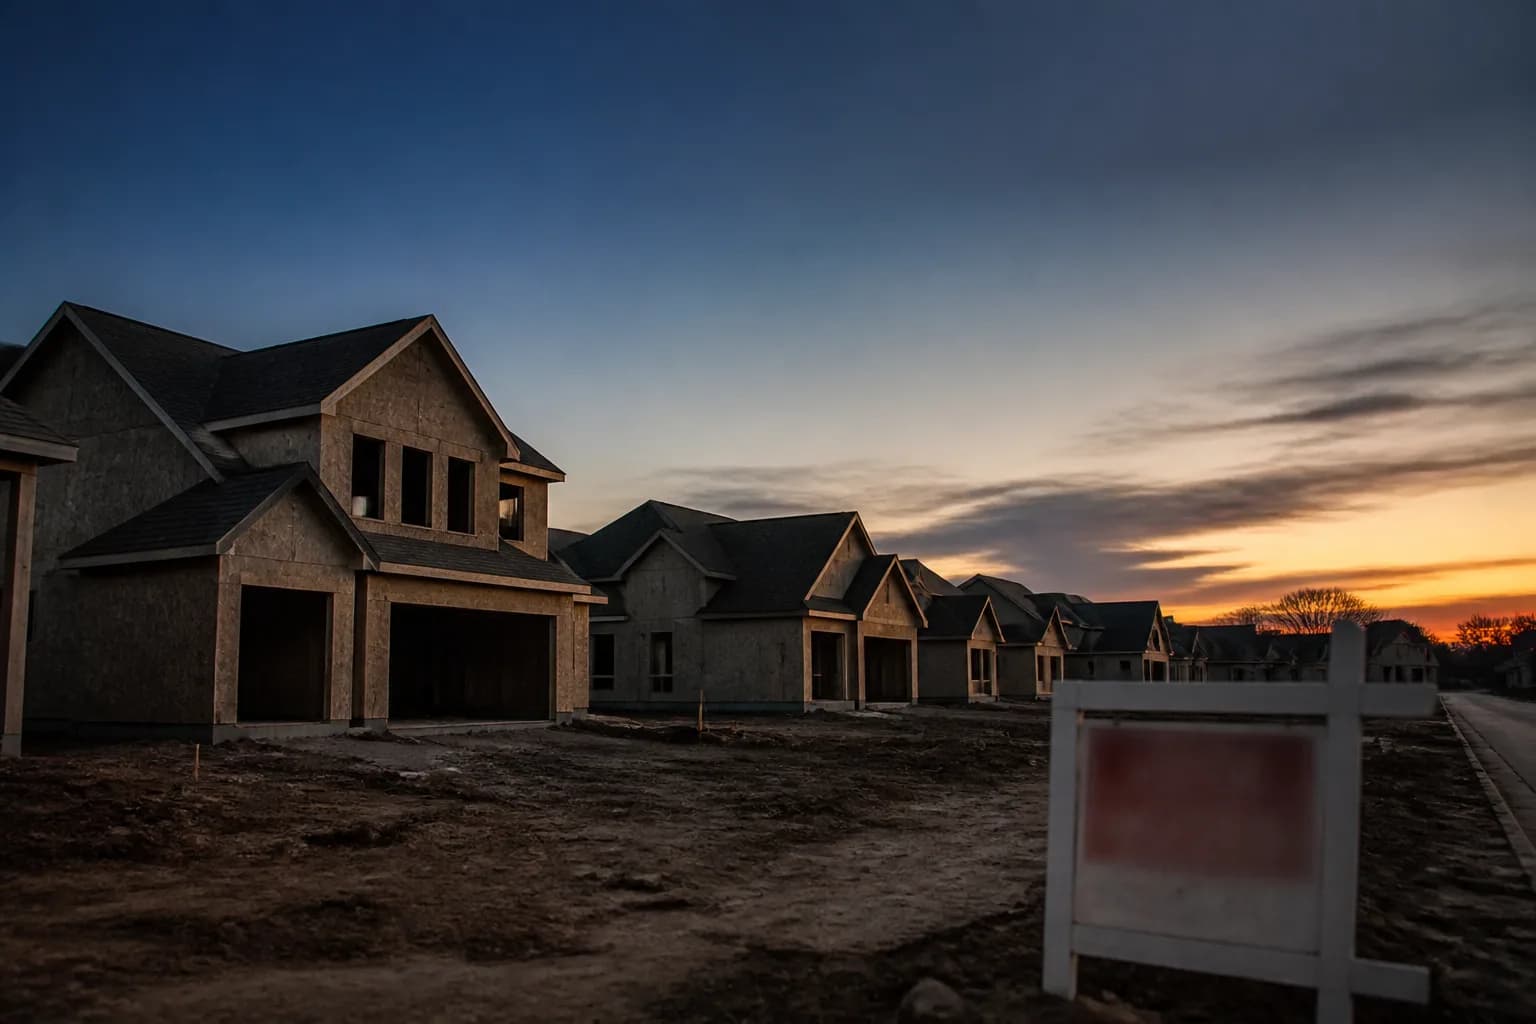
The Resident Survivor argues that mortgage rates are a secondary factor and that the primary driver in these specific cities is a supply-and-demand imbalance created during the 2021-2023 migration boom. Builders in Austin's suburbs — Georgetown, Pflugerville, Frisco, McKinney — added units aggressively while national and regional inflows from other states slowed. The video cites Texas Real Estate Research Center data claiming new home starts in the McKinney area outpaced household formation by roughly three to one during the pandemic years.
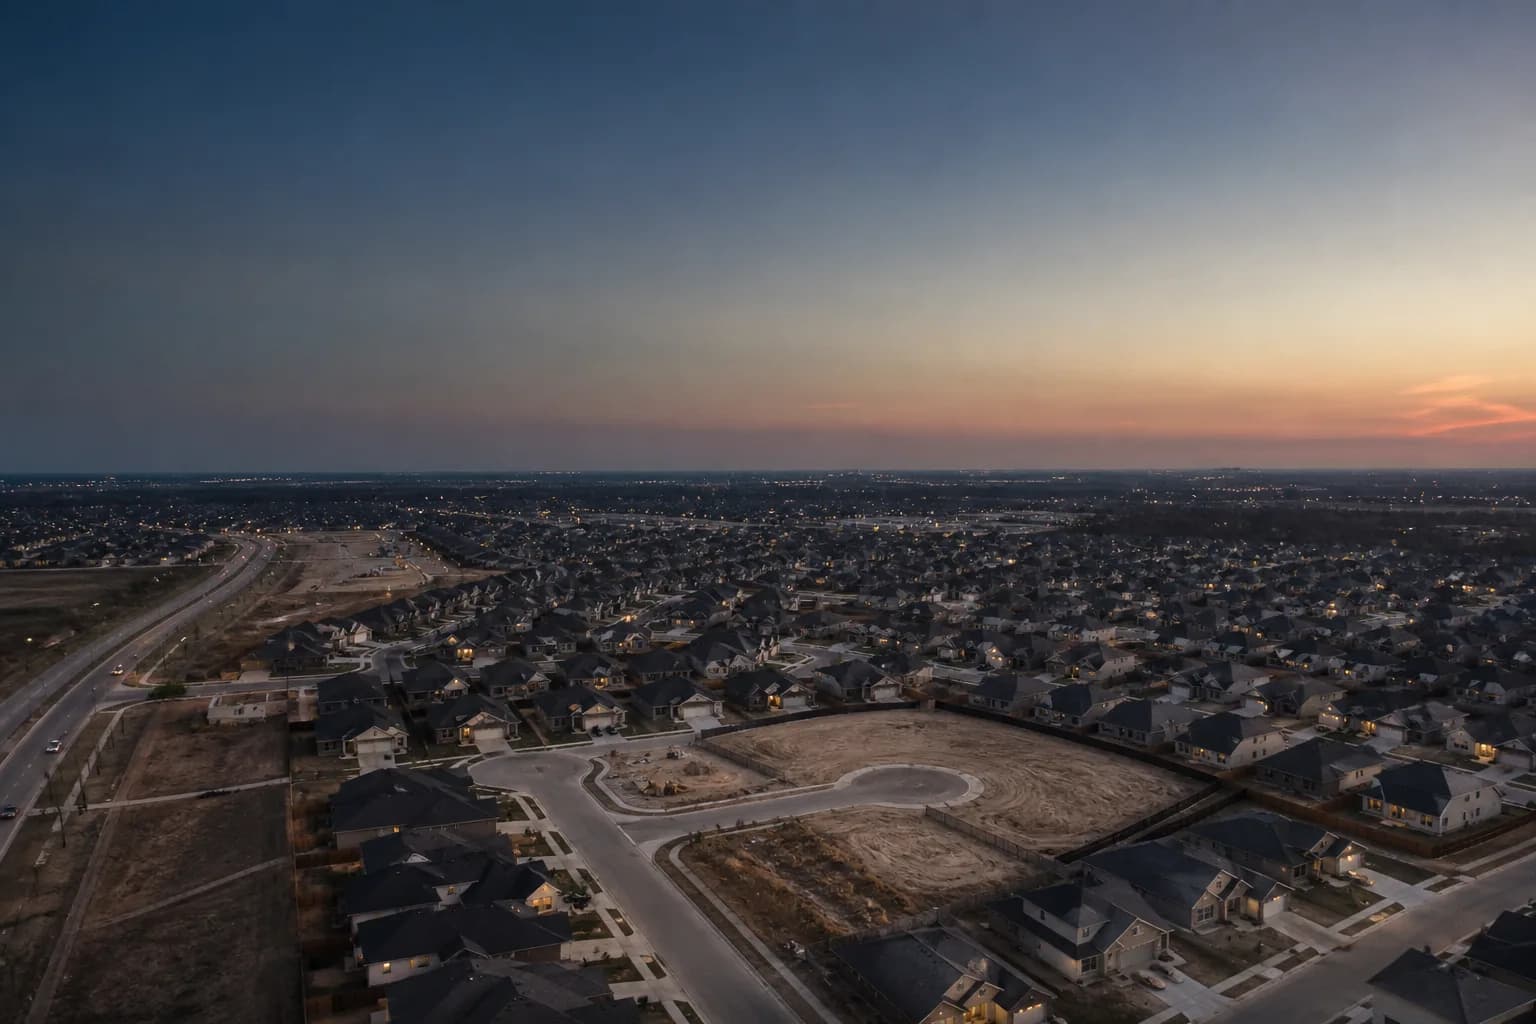
That imbalance shows up in the numbers above as inventory spikes of 125% to 300% depending on the city. When supply grows that fast and buyer demand cools — whether from affordability limits, return-to-office mandates pulling remote workers back to coastal metros, or simple saturation — sellers compete on price, not just with each other but against builders offering rate buy-downs and incentives that private sellers can't easily match.
A second, less obvious driver is the property tax lag. Texas has no state income tax, so cities and counties lean heavily on property taxes funded by county appraisal districts. Those districts often reassess on an annual cycle, meaning a home's taxable value can stay pinned near its 2022 peak even after the market price has fallen. The video calls out Travis County (Austin) and Williamson County (Round Rock, Georgetown) specifically, arguing that owners are paying near-peak tax bills on assets now worth 15-20% less. This is a real structural issue in fast-cycling markets, not unique to Texas — Florida homeowners face a related mismatch, which we've covered in detail in our piece on the Florida TRIM Notice and the Save Our Homes cap.
Galveston is the outlier on this list because its story is mostly about insurance, not construction. The video cites Texas Department of Insurance data showing coastal premiums up roughly 40% over two years, plus AirDNA figures showing short-term rental revenue down about 28%. When insurance and financing costs rise faster than rents, investor-owned coastal properties become cash-flow negative, and that pressure shows up as forced listings rather than organic buyer demand shrinking.
The overbuilding pattern isn't unique to Texas
Builder gluts pushing down prices in fast-growth suburbs is a pattern showing up well beyond Texas right now. Georgia has seen a similar wave of builder incentives and price cuts in formerly hot exurbs, detailed in our report on Georgia towns where builders are slashing new-home prices. The mechanics are the same: builders committed to land and permitting years ago, migration assumptions didn't hold up, and now unsold inventory forces price competition that spills over into the resale market.
The video's Frisco and McKinney segments also raise institutional and builder selling as a factor — private sellers competing against "corporate builders" with rate buy-downs. That's a smaller-scale version of a broader trend our readers have asked about regarding large-scale investor and builder activity in housing, which ties into the coming 2027 restrictions on Wall Street single-family home buying.
What this means for you: buyers, sellers, and owners
If you're buying in one of these markets:
- Don't rely on list-price discounts alone. Ask for the county's current appraised value and recent comparable closings, not just the asking price history, since tax bills are based on assessed value, not your negotiated price.
- In master-planned communities with remaining undeveloped phases, expect the builder to keep offering incentives that undercut resale value — a private seller usually can't compete with a builder's rate buy-down.
- For coastal or vacation-rental purchases, request the seller's actual insurance premium history and, where relevant, flood elevation documentation before making an offer.
If you're selling:
- Days-on-market figures in the 85-120 day range cited across these cities suggest pricing needs to reflect current comps, not 2022 peaks. Overpricing against a rising-inventory backdrop tends to add weeks, not just days, to your listing.
- If you're competing against new construction nearby, factor in that builders can offer incentives (closing costs, rate buy-downs, upgrades) that are hard to match dollar-for-dollar; a modest, upfront price adjustment may do more than trying to match every incentive.
If you already own and aren't selling:
- A paper decline in value doesn't change your mortgage payment, but it can affect refinancing options and home-equity borrowing capacity.
- Watch your county appraisal notice closely. If assessed values lag actual market prices, you may have grounds to protest your appraisal, particularly in Texas counties where informal review periods are available annually.
Where this narrative needs a reality check
This list is a single creator's ranking built from a mix of named sources (Redfin, Zillow, Realtor.com, CoreLogic, local realtor boards) and the creator's own commentary and dollar-loss estimates, which aren't independently sourced in the video. Several of the framing choices are worth treating with caution.
First, "price decline" is measured from each city's own local peak, not from a consistent national baseline, so comparing a 22% Austin decline to a 13% McKinney decline isn't quite apples-to-apples without knowing exactly when each peak occurred and what dataset defines it. Second, none of the per-household dollar-loss figures (for example, roughly $200,000 in Austin) are attributed to a specific study in the video; they read as illustrative estimates rather than measured averages. Third, national data from the National Association of Realtors and Freddie Mac's Primary Mortgage Market Survey shows mortgage rates have, in fact, been a major driver of affordability and demand nationwide over the past two years — dismissing rates as a secondary factor understates their role even if local oversupply is compounding the effect.
That doesn't mean the underlying trend is wrong. Elevated inventory, longer days-on-market, and builder price cuts in fast-growth Texas suburbs are consistent with what's been publicly reported by several of the cited sources. But readers should verify current figures directly with Redfin, Zillow, or a local Realtor before making a buying or selling decision based on this ranking alone.
What to watch next
Keep an eye on a few concrete indicators in these markets over the coming months: county appraisal notices (typically mailed in spring), local MLS inventory and days-on-market trends, and any changes in builder incentive levels in master-planned communities. Mortgage origination trends are also worth tracking at the national level, since a slowdown in lending activity can compound local oversupply — a dynamic we've explored in our coverage of the mortgage origination slump heading into 2027. If oil prices soften further, Midland's boom-bust cycle described in the video is also one to monitor, since that market's fortunes are tied more to commodity prices than to broader housing trends.