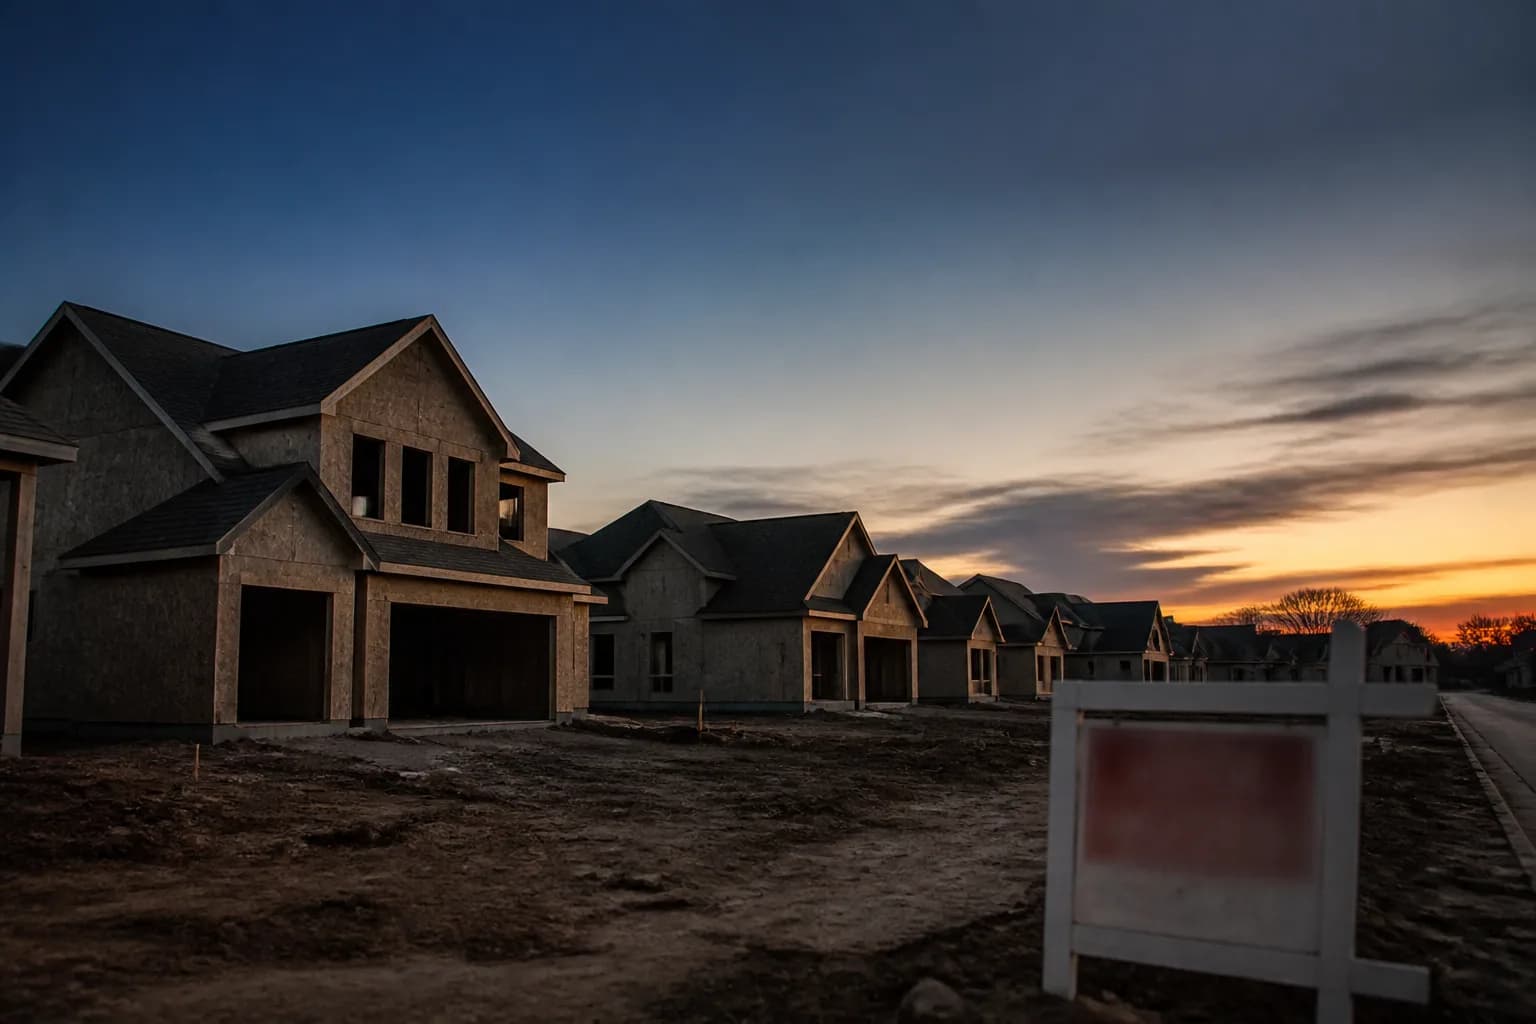
Which Georgia towns are seeing builder price cuts?
A YouTube video from the channel TD World Canvas argues that builders in 10 Georgia exurbs — Loganville, Hoschton, Braselton, an unnamed commuter suburb, Canton, Woodstock, Dallas, Gainesville, McDonough and Jefferson — are cutting new-construction prices and offering large incentives as unsold inventory piles up. The video frames this as evidence of a looming "crash," with town-by-town price-drop forecasts ranging from 20% to 47%.
The core signal is worth taking seriously: builders across the fast-growing Atlanta exurbs have leaned harder on incentives — rate buydowns, design credits, HOA-fee waivers — over the past two years as mortgage rates stayed elevated and construction outpaced local demand in some submarkets. That part tracks with what national builder surveys and housing data have shown since 2023.
What doesn't hold up under scrutiny is the specific math. The video's percentage-loss figures escalate in a suspiciously tidy sequence — 20%, 30%, 35%, 40%, 42%, 44%, 45%, 46%, 46.5%, 47% — attached to citations from Realtor.com, Zillow, Redfin, NAHB, the Census Bureau and others that are not independently checkable in the video itself. Readers should treat those numbers as one creator's dramatized projections, not confirmed market data.
The 10 towns and what the video claims
Here is what TD World Canvas reports for each town, presented as the creator's claims rather than verified facts:
| Town | Claimed price-cut forecast | Claimed equity loss | Notable incentive cited |
|---|---|---|---|
| Loganville | 20–25% by spring | ~$100,000 | $60,000 in mortgage rate buydown cash |
| Hoschton | ~30% | ~$150,000 | Free luxury upgrades |
| Braselton | ~35% | ~$250,000 | $50,000 pool packages |
| Unnamed commuter suburb | ~40% | ~$300,000 | 3 years of HOA fees covered |
| Canton | ~42% | ~$320,000 | Free finished basements |
| Woodstock (townhome sector) | ~44% | ~$400,000 | Deep price cuts on standing townhomes |
| Dallas, GA | ~45% | ~$350,000 | $80,000 design-center credits |
| Gainesville | ~46% | ~$450,000 | Rebranding luxury homes as "family" homes |
| McDonough | ~46.5% | roughly half a million dollars | Rate buy-downs on unsold spec homes |
| Jefferson | 47% | ~$600,000 | Offers to pay down buyer credit-card debt |
TD World Canvas also cites specific inventory metrics for each town — for example, a claimed 180% year-over-year jump in Loganville listings, a 210% increase in Hoschton homes sitting 60-plus days, and a 350% spike in unsold new-construction listings in Jefferson over 12 months. These figures are attributed to Redfin, Zillow, Realtor.com and other named sources, but the video does not link to or quote the underlying reports, so we cannot confirm them independently. We're flagging that gap rather than repeating the numbers as fact.
Why the claims deserve skepticism
Georgia's exurban ring around Atlanta did see a genuine building boom during 2021–2022, when low rates pulled buyers toward cheaper land on the metro fringe. It's plausible that some of these towns now have more standing inventory than builders expected. But a few things in the video don't add up:
- The dollar-loss figures imply extremely high home prices. A $600,000 loss on a 47% decline in Jefferson implies a peak price above $1.2 million — far above typical new-construction pricing in that market. That mismatch suggests the numbers were generated for dramatic effect rather than derived from actual listing prices.
- The percentages increase too neatly. Real housing corrections don't usually escalate in near-perfect 2-to-5-point increments across unrelated towns.
- No links or report names are given. Citing "Zillow," "Redfin" or "NAHB" without a specific report, date or figure makes the claims impossible to verify.
None of this means builder incentives aren't rising in these markets — it means the specific crash percentages should be read as a content creator's narrative device, not as market forecasts you should act on.
What's actually happening with builder incentives nationally
To ground this in verifiable context: the National Association of Home Builders has tracked rising use of sales incentives — price cuts, mortgage rate buydowns and free upgrades — among builders since interest rates climbed from their pandemic-era lows. Freddie Mac's Primary Mortgage Market Survey has shown 30-year fixed rates holding well above the 3% range seen in 2021, which has slowed both resale and new-home demand in many high-growth metros. The Census Bureau's monthly New Residential Sales report tracks national new-home inventory and months-of-supply figures, which is the kind of data point that would actually confirm or refute claims of an oversupply in a specific Georgia county.
This pattern isn't unique to Georgia. Similar builder-incentive stories have played out across the Sunbelt, and it connects to broader questions about how much speculative and institutional capital flowed into new construction during the boom years. Readers following that thread may find our coverage of the Wall Street Homebuying Ban: What 2027 Means for Buyers relevant, since large-scale investor buying was part of what fueled exurban building sprees in the first place. The financing side of this slowdown is also covered in Mortgage Slump Deepens: What Origination Collapse Means for 2027, which looks at why fewer originations are squeezing builders' ability to move inventory quickly.
What this means for you
If you're buying new construction in one of these towns:
- Ask the builder directly for months-of-supply data on their specific development, not town-wide averages from a video.
- Treat incentives (rate buydowns, upgrade credits, HOA waivers) as a starting point for negotiation, not a final offer — but confirm whether an incentive is temporary (like a 2-1 buydown that expires) or permanent.
- Get a written breakdown of how much of any "credit" applies to the purchase price versus optional upgrades.
- Have your own lender run numbers independently of the builder's in-house lender to confirm your real affordability, based on verified income and debt — not an online estimate.
If you own a home in one of these areas:
- Rising new-construction inventory and incentives can put downward pressure on resale comps nearby, even if your home isn't new. Watch local MLS data on days-on-market and price reductions in your specific subdivision.
- If you're planning to sell soon, expect more competition from builders offering financing perks that resale sellers can't easily match.
If you're an investor:
- Elevated incentive activity in a submarket is often a sign builders need to move inventory before a fiscal quarter closes, which can create short-term negotiating windows — but it is not, by itself, evidence of a broad price crash.
- Local oversupply patterns have shown up elsewhere in Sunbelt markets too; our report on Florida Foreclosures Spike 300%: What's Driving the Surge in 2026 covers a related dynamic of rapid overbuilding meeting affordability limits.
What to watch next
- Freddie Mac's weekly Primary Mortgage Market Survey for the direction of 30-year fixed rates, which drives builder incentive spending.
- Census Bureau New Residential Sales data, released monthly, for national and regional months-of-supply figures.
- NAHB/Wells Fargo Housing Market Index, a monthly builder-sentiment survey that tracks incentive use and price-cutting nationally.
- Local county tax assessor and MLS data for the specific Georgia towns named here, since town-level detail isn't available in national datasets.
The bottom line
Builder incentives are a real and well-documented response to slower demand and higher financing costs — that much of TD World Canvas's video is consistent with the broader housing picture. But the specific crash percentages and dollar-loss figures attached to Loganville, Jefferson, McDonough and the other towns named in the video are unverified projections, not confirmed data from Zillow, Redfin or the Census Bureau. Buyers and owners in these markets should use official, sourced data — not a single video's town-by-town scorecard — before making a purchase, sale or investment decision.