The short answer
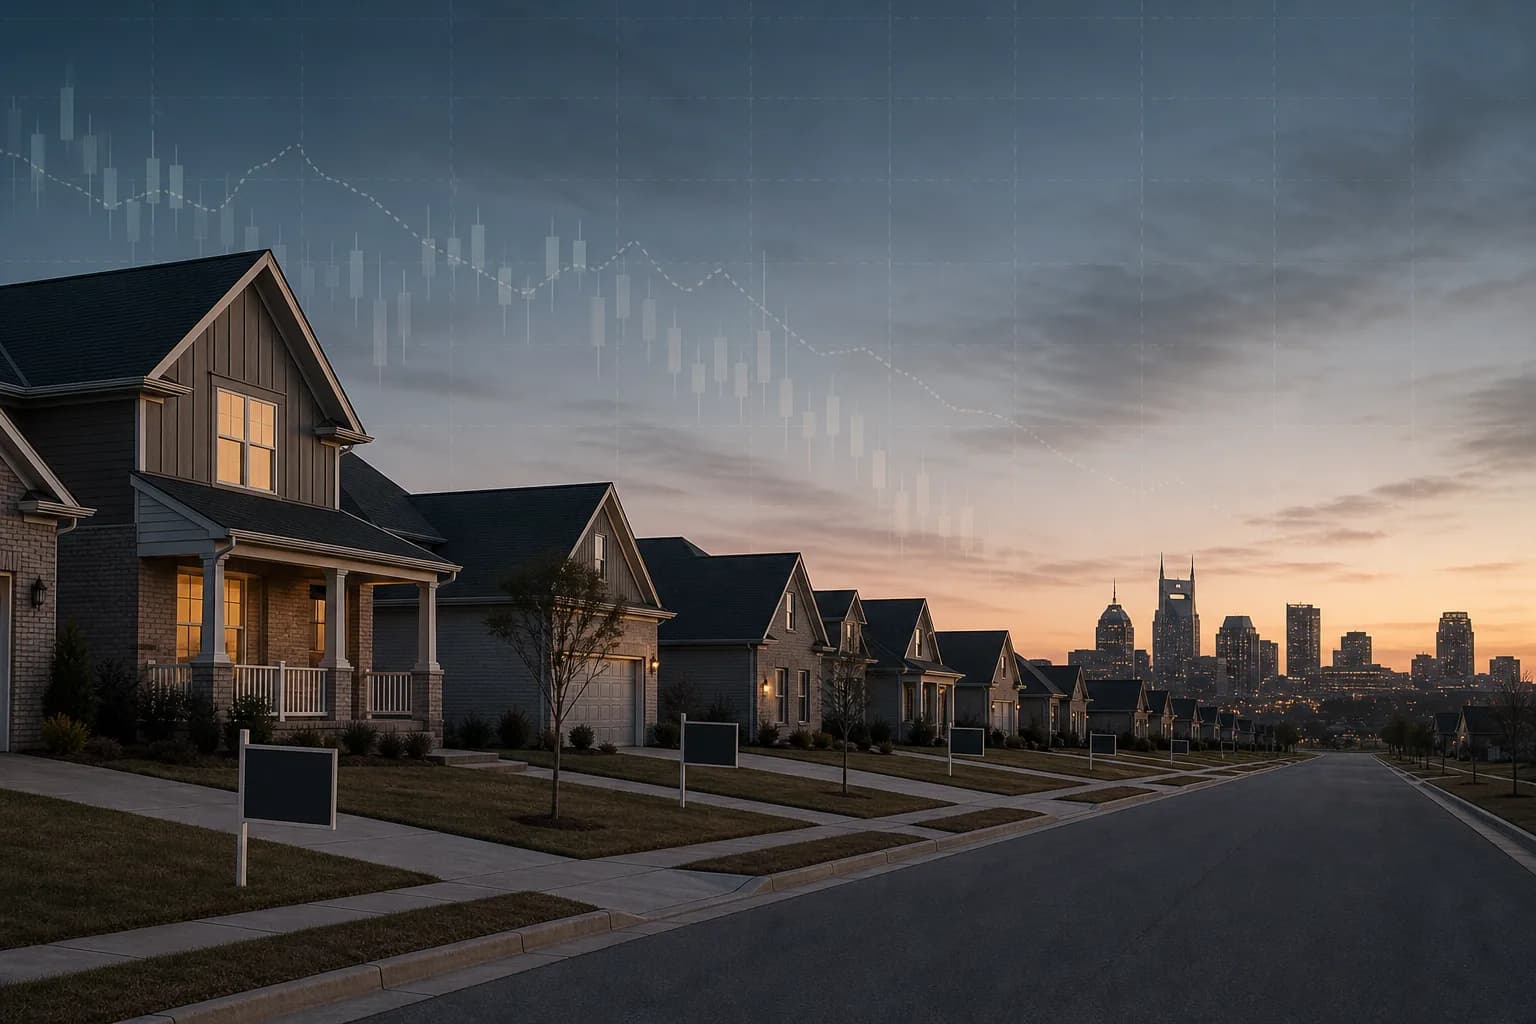
Twelve Florida metros are posting some of the steepest home-price declines in the country right now, and the same underlying story explains most of them: years of pandemic-era price gains of 70% to 90% are partly reversing, at the same time insurance costs and a severe 2025-2026 drought are making ownership more expensive and less certain. The steepest declines cluster in Southwest Florida — Cape Coral, Fort Myers, Naples, Punta Gorda and North Port — according to an analysis by the YouTube channel Discover The Cities, which combined regional water-district data with national home-price rankings. None of these markets are collapsing the way 2008-era markets did. But the combination of falling prices, rising insurance bills and shrinking water supplies is real, measurable, and worth understanding before you buy, sell, or hold in these areas.
Why Florida's boom is giving back gains
For most of the 2020s, Florida was the poster child for the remote-work migration boom. Retirees, remote workers and residents of higher-tax states moved in, and prices followed. Cape Coral values, for example, rose by roughly 80% in just a couple of years during the boom, according to the video.
That kind of run-up rarely holds indefinitely, and two pressures are now working against it at the same time.
Insurance costs. Florida's average homeowners insurance premium has climbed to roughly $8,300 a year, the highest average of any state, per figures cited in the video. That number changes the monthly math for buyers who might otherwise qualify for a mortgage, and it's a recurring theme in other coverage of the state, including our look at why people are leaving Florida.
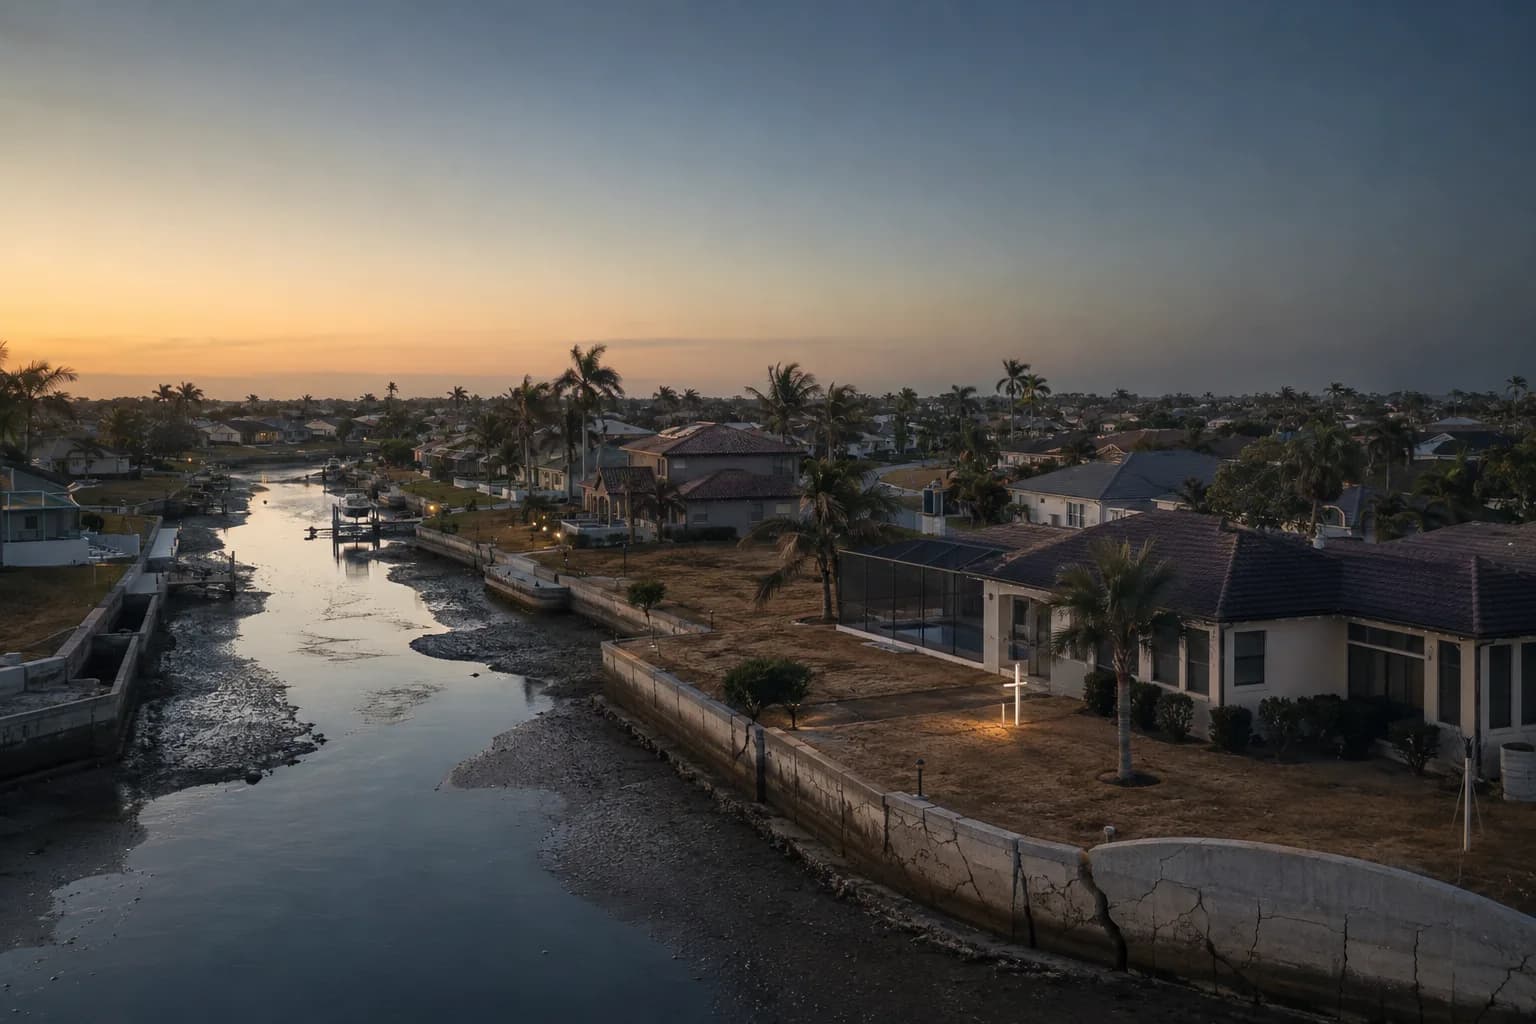
Water stress. By spring 2026, close to 80% of Florida fell into what the U.S. Drought Monitor classifies as extreme drought conditions. NASA, reviewing satellite and rainfall data, called it the state's most widespread and severe drought since 2012. In response, the Southwest Florida Water Management District declared an official water shortage across 16 counties, citing roughly a 13-inch rainfall deficit, and limited outdoor lawn watering to once a week for millions of residents.
Those two forces — cost and scarcity — are landing on housing markets that were already due for a cooling-off period after years of outsized gains.
The 12 cities, ranked
The table below summarizes the metros the video highlights, roughly in the order of severity it presents (most acute combination of price decline and water stress listed first). Figures are as cited in the video; treat percentage changes as approximate and tied to the specific month or quarter the creator referenced.
| Rank | City / Metro | Price Signal | Water/Environmental Stress |
|---|---|---|---|
| 1 | Cape Coral | Median ~$370,000, down ~5% (metro area closer to ~10%) | Mid-Hawthorne aquifer hit a record low near 94 ft below sea level; emergency well restrictions |
| 2 | Fort Myers (Cape Coral-Fort Myers metro) | Median ~$340,000, down ~9% year-over-year in Q1 2026 — cited as the largest such drop of any major U.S. metro | Caloosahatchee River affected by Lake Okeechobee discharges and blue-green algae |
| 3 | Naples | Single-family median down >19% (Florida Realtors); repeat-sales measures closer to 4-5% | Red tide advisories from Naples Pier to Vanderbilt Beach in early 2025 |
| 4 | Punta Gorda | Down ~8%, about $26,000 off the typical home's value — largest of any Florida metro cited | Rising unsold inventory in Charlotte County; recovery still underway after Hurricane Ian |
| 5 | North Port | Median ~$335,000, down 9-10% — cited in one national analysis as the largest U.S. decline over a 12-month span | Regional water shortage order in effect |
| 6 | Tampa | Metro values down ~6% in 2025; over 53% of listings had a price cut by late October | Sits on the edge of "Sinkhole Alley"; under once-a-week watering rules |
| 7 | Lakeland | Median ~$325,000, down several percentage points; roughly two-thirds of listings carry a price cut | Kissingen Spring, once a local swimming spot, has stopped flowing entirely |
| 8 | Lehigh Acres | Median ~$310,000, down more than 9%; homes averaging ~80 days on market | Shares Lee County's drought and aquifer pressure |
| 9 | Ocala | Cited in one analysis as having the largest drop in seller profit margins of any U.S. market in a recent quarter | Silver Springs flow down an estimated one-third to one-half since the 1930s |
| 10 | Venice | Some monthly figures show double-digit year-over-year drops; broader measures closer to single digits | Red tide affected the coastline in winter 2024-2025 |
| 11 | Spring Hill / New Port Richey | Tampa Bay-area market has shifted toward buyers, with rising inventory and price cuts | Located in "Sinkhole Alley" (Pasco, Hernando, Hillsborough counties) |
| 12 | Stuart / Treasure Coast | Port St. Lucie median ~$420,000 — a cooling market, not a collapse | Lake Okeechobee discharges measured with microcystin toxin near 22 parts per billion, versus an 8 ppb federal health advisory threshold |
Two forces colliding, not twelve separate stories
Discover The Cities argues that these aren't 12 unrelated local problems — they're symptoms of the same root cause: growth that outpaced the water supply, insurance market and infrastructure meant to support it. Saltwater intrusion into aquifers, disappearing springs, sinkhole risk and toxic algae blooms are all downstream of the same decades of heavy groundwater pumping and rapid development.
It's worth being precise about terminology here. A median home price is the middle value of all homes that sold in a period — it's sensitive to which homes happen to sell. Naples is the clearest example: its single-family median dropped more than 19% year-over-year, largely because far fewer $10 million-plus luxury sales closed during that stretch, pulling the median down even though typical homes lost far less value. A repeat-sales index — the methodology behind the Federal Housing Finance Agency's House Price Index and the S&P CoreLogic Case-Shiller Index — instead tracks the same properties' prices over time, which is why it showed Naples' real decline closer to 4-5%. When you see a dramatic percentage in a headline, it's worth asking which of these two measures produced it.
What this means for you
If you're a buyer: Falling prices and rising inventory can mean more negotiating room, but budget for insurance premiums that may run well above the $8,300 statewide average in coastal, canal-front or older-condo communities. Ask about well versus municipal water service, recent water-restriction orders, and whether the property sits in a sinkhole-prone county before writing an offer.
If you're a seller: In markets like Tampa, where more than half of listings carried a price cut by late October, pricing realistically from the start matters more than testing the market high. Homes in Lehigh Acres were taking around 80 days to sell — plan your timeline accordingly and expect buyers to negotiate.
If you're an owner staying put: A price pullback of 5-10% off a 70-90% pandemic-era gain still generally leaves long-term owners ahead on paper. The bigger monthly concern for many Florida households is the combination of insurance premiums, HOA or condo assessments, and property taxes rather than paper equity swings. For related coverage on how the risk of holding property in Florida is shifting more broadly, see our review of Florida cities where 2026 buying risk is highest.
If you're an investor: Falling seller profit margins — cited in the video as the steepest of any U.S. market recently in Ocala — are often an early signal that short-term flippers are stepping back. That can be a leading indicator of a softening market, but it can also simply mean the easiest gains have already been captured.
Where this view has limits
Discover The Cities is careful to frame this as a correction, not a crash, and that distinction deserves scrutiny rather than a passing mention. A market falling 5-10% off gains of 70-90% is mathematically a very different event than the leveraged, foreclosure-driven collapse of 2008-2009, when national prices fell roughly 30% amid a wave of subprime defaults. Florida's current pullback appears to be demand-driven — buyers pausing over affordability and insurance costs — rather than a wave of forced selling.
It's also worth noting that several of the most dramatic figures in this ranking (Ocala's seller-margin decline, North Port's "largest U.S. decline" ranking) are drawn from unnamed national analyses referenced secondhand in the video rather than a single named, linkable dataset. That doesn't make them wrong, but readers comparing markets should cross-check current numbers against Florida Realtors' monthly reports, Zillow, Redfin or the FHFA House Price Index before making a financial decision, since month-to-month figures in smaller markets like Venice can swing sharply simply because fewer homes close in a given month.
None of this is unique to Florida in isolation — inventory buildups and price cuts are showing up in other Sun Belt and previously hot markets too, a pattern we've also tracked in Texas cities where prices are falling fastest and in broader reporting on whether the U.S. housing market is headed for a recession.
What to watch next
Keep an eye on a handful of concrete signals in the months ahead:
- SWFWMD and other water management district updates — whether the 16-county water shortage order is extended, eased or tightened as drought conditions evolve.
- Insurance renewal notices — statewide average premiums moving further above the roughly $8,300 benchmark cited here would add more pressure on affordability.
- Freddie Mac's Primary Mortgage Market Survey — mortgage rate movements affect how much buyers can absorb even at lower list prices.
- Local price-cut share and days-on-market data — Tampa's jump past 53% of listings with a price reduction is the kind of metric that tends to move before headline median prices catch up.
- Repeat-sales indices versus median price — watch both, especially in luxury-heavy markets like Naples, to separate real value changes from shifts in what happened to sell that month.
Florida's water and housing pressures didn't appear overnight, and they're unlikely to resolve overnight either. For now, the most useful takeaway isn't any single city's ranking — it's the pattern connecting insurance costs, water scarcity and cooling demand across a state that grew faster than its infrastructure could keep pace.