Are Carolina Home Prices Actually At Risk in 2026?
Some North and South Carolina housing markets are showing real warning signs heading into 2026: rising for-sale inventory, sharply higher insurance premiums in coastal counties, and fresh flood-zone reassessments after recent storms. That is the core claim in a widely discussed YouTube video from creator TD World Canvas, which names 10 Carolina cities, from Charlotte to Spartanburg, where it argues buyers face elevated risk of near-term price softness or high carrying costs.
The video is opinionated and, at points, uses dramatic language to describe distressed markets and collapsing values. But underneath the delivery are four concrete risk categories worth taking seriously if you are house-hunting in the Carolinas: overbuilding relative to demand, insurance cost inflation, flood and storm exposure, and early signs of price softness in previously hot submarkets.
This article separates those factors, explains what they mean in practice, and flags where the claims need independent verification before you make a decision.
The Four Risk Factors Behind the Warning
TD World Canvas built its list around a repeating pattern across Carolina metros. Four issues show up again and again:
- Overbuilding relative to household formation: new construction and investor-owned inventory hitting the market faster than local buyer demand can absorb it.
- Insurance cost inflation: coastal and inland storm-exposed counties seeing large year-over-year premium increases.
- Flood and storm risk: FEMA flood-map redraws, tidal flooding, and post-hurricane landslide exposure changing what is insurable and where.
- Price softness: rising days-on-market, price cuts, and in some neighborhoods outright year-over-year price declines.
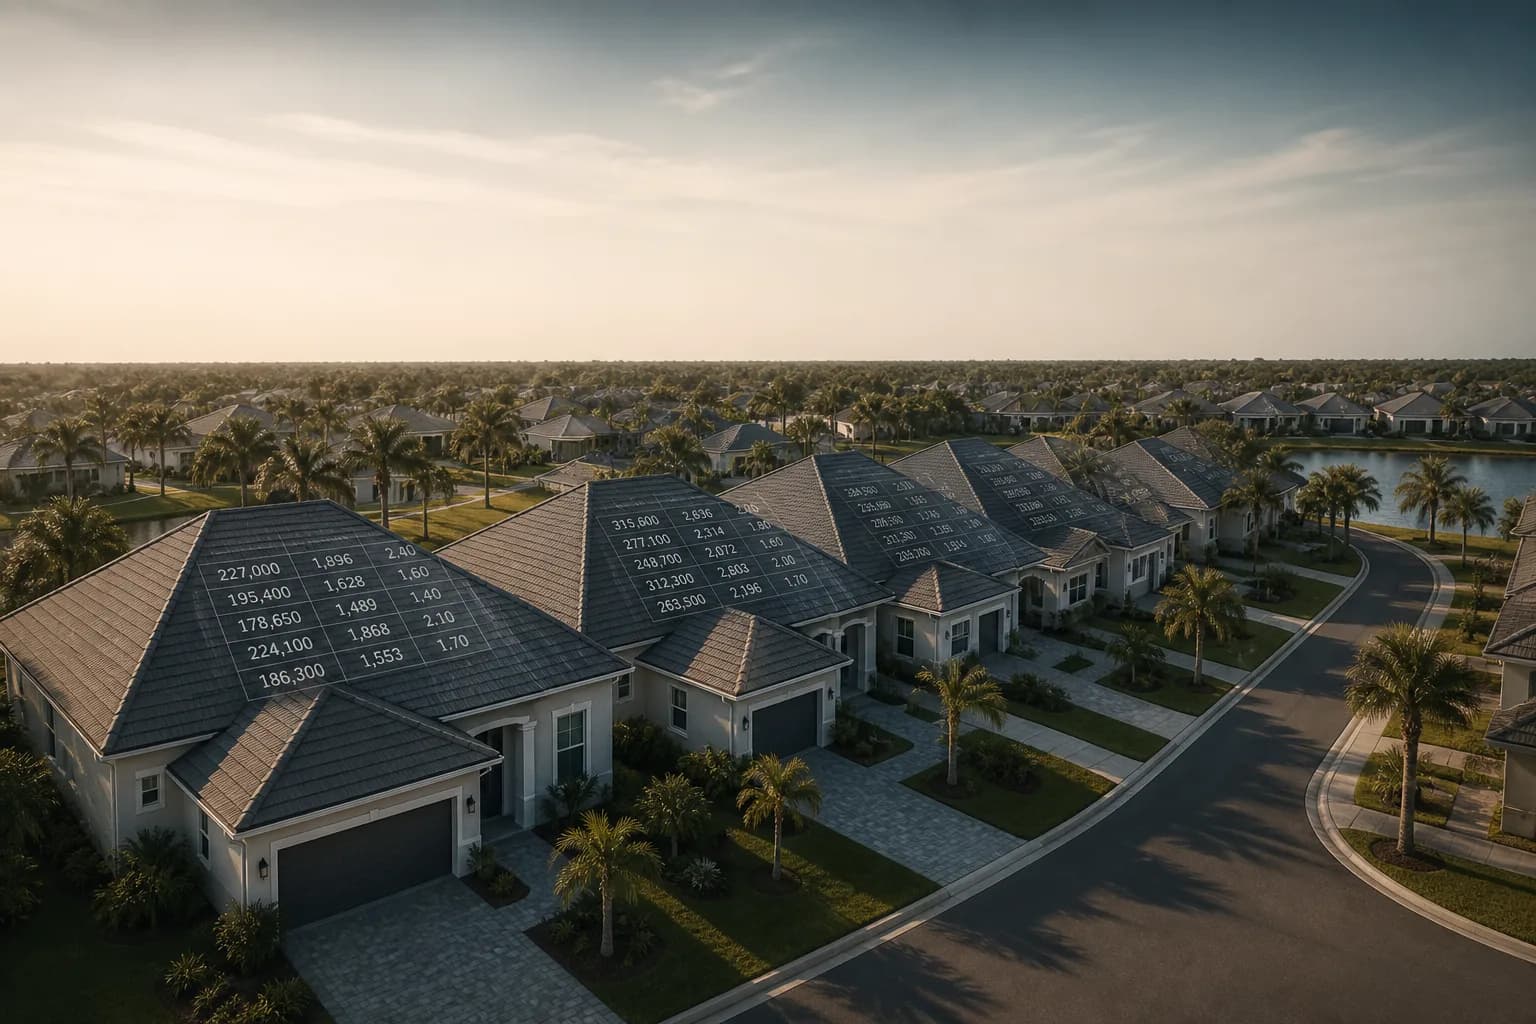
The table below summarizes the figures cited in the video for each risk category. These are the creator's cited numbers from sources like Redfin, Zillow, CoreLogic, NOAA and local Realtor associations. Treat them as claims to verify locally, not confirmed benchmarks, since the video's sourcing was not independently checked for this article.
| City | Primary risk flagged | Cited figure |
|---|---|---|
| Charlotte, NC | Overbuilding and investor resales | Active listings up about 35 percent year-over-year, cited to a WSJ analysis |
| Charleston, SC | Tidal flooding and insurance | Homeowners premiums up about 45 percent in 2 years, cited to SC Dept of Insurance |
| Raleigh, NC | Luxury oversupply | Listings over 700,000 dollars up about 55 percent year-over-year, cited to Redfin |
| Myrtle Beach, SC | HOA special assessments | Special assessments on older high-rises up about 150 percent |
| Wilmington, NC | Coastal insurance | State rate bureau sought about a 99 percent coastal premium increase |
| Greenville, SC | New-home inventory glut | About 11 months of new-construction supply versus a 4-month healthy norm |
| Asheville, NC | Flood and landslide risk | Localized home values down about 18 percent after Hurricane Helene |
| Mount Pleasant, SC | Luxury price correction | Median sale prices down about 12 percent; inventory over 1 million dollars up about 65 percent |
| Durham, NC | Flipper and biotech slowdown | About 44 percent of active listings had a price cut in 60 days |
| Spartanburg, SC | Extreme oversupply | Active inventory up about 180 percent year-over-year |
Overbuilding: The Inland Boomtown Problem
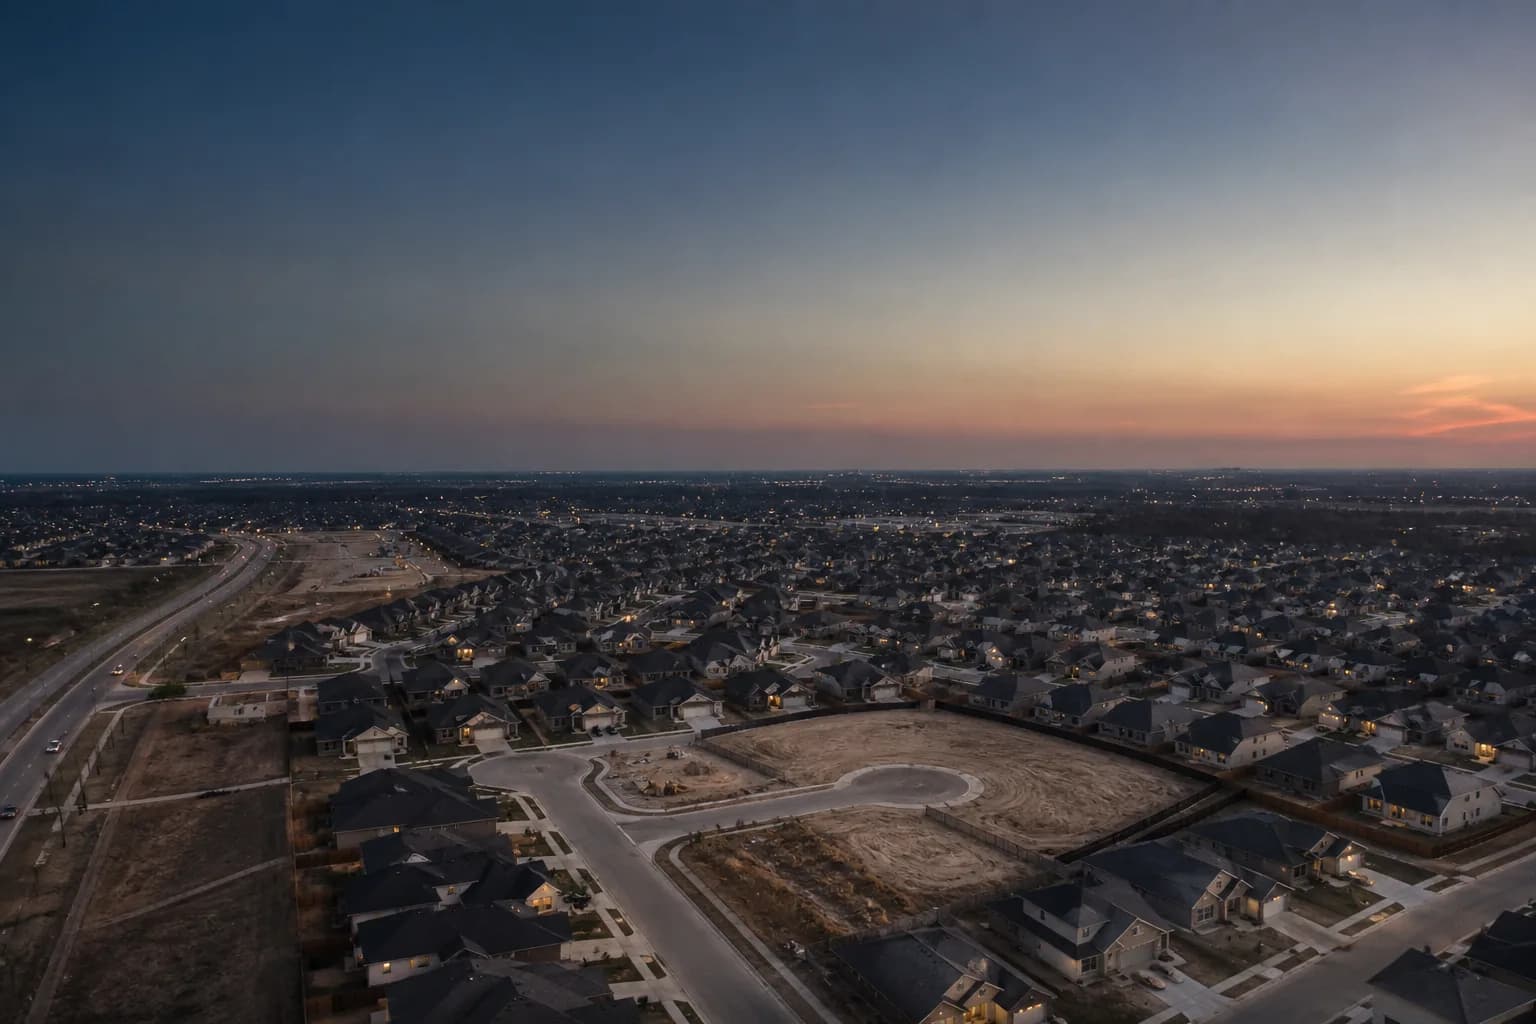
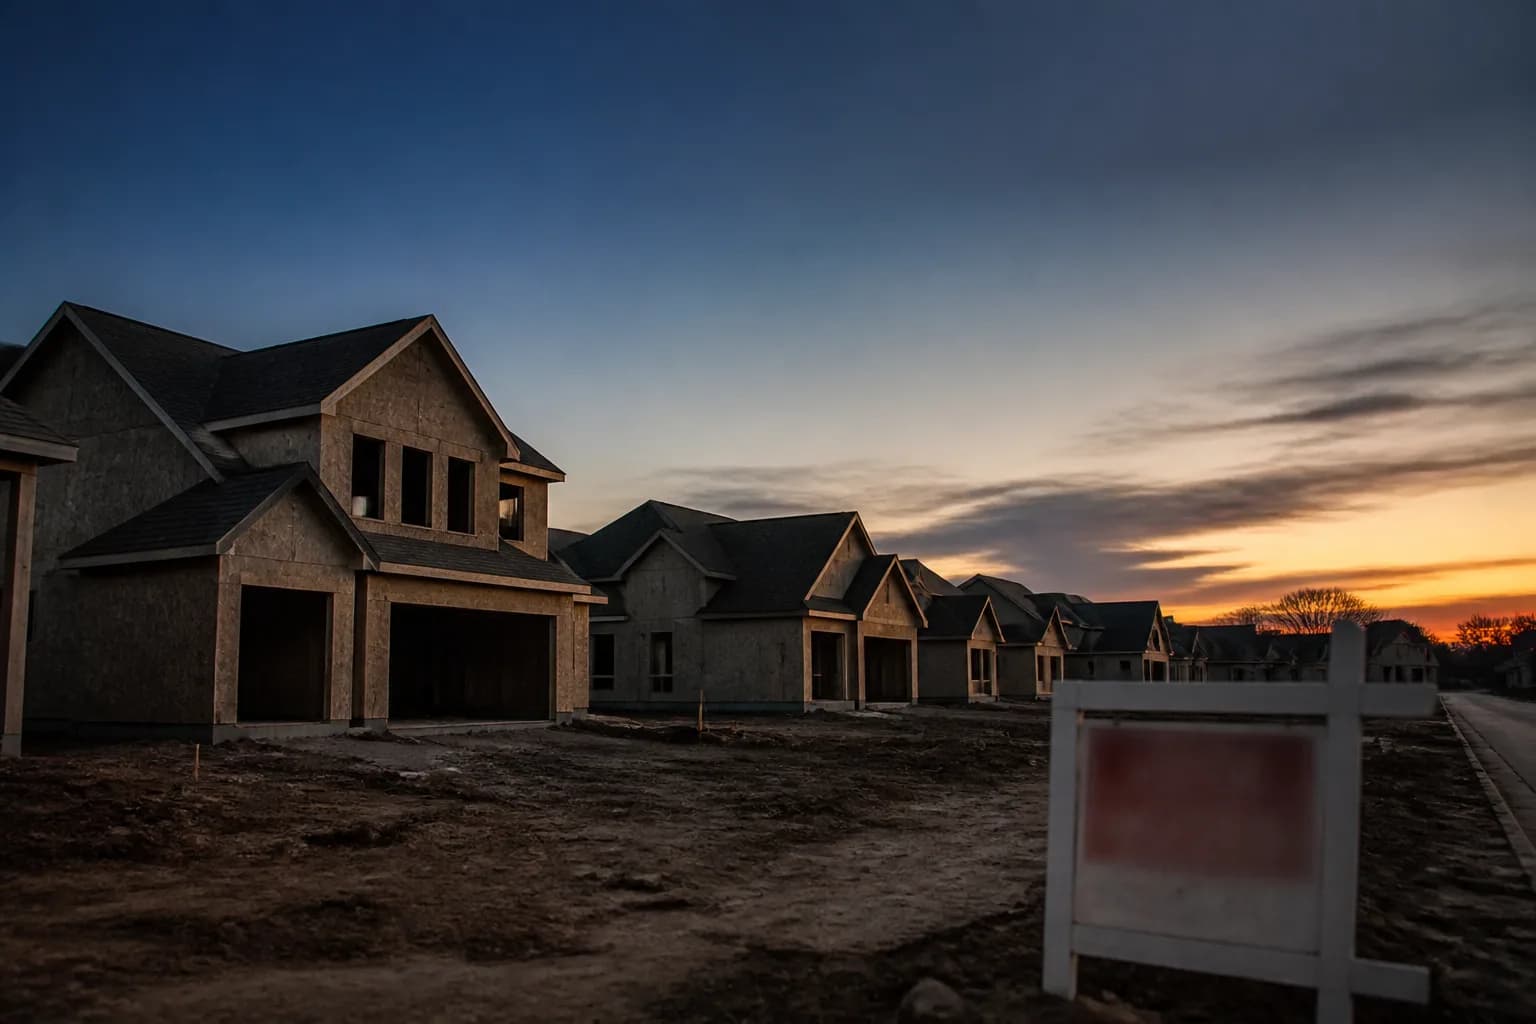
Charlotte, Raleigh, Greenville, Durham and Spartanburg share a common storyline in the video: builders and investors kept adding supply years after the pandemic-era migration wave that justified it. TD World Canvas cites the Charlotte Regional Realtor Association's claim that new-construction permits have outpaced household formation by roughly 3-to-1, and similar imbalances in Greenville, with an 11-month supply of new homes, and Spartanburg, with inventory up 180 percent year-over-year by the video's count.
This pattern echoes what is happening in other fast-growing Sunbelt states. Builders in parts of Georgia have also been cutting prices to move stalled inventory; see our look at 10 Georgia Towns Where Builders Are Slashing New-Home Prices. Texas has its own version of the same imbalance; see 10 Texas Cities Where Home Prices Are Falling Fastest in 2026. The underlying mechanic is consistent: when new supply significantly outpaces the number of new households forming, sellers compete on price, and buyers gain negotiating leverage.
Why it matters: a high months-of-supply figure, generally anything above 6 months is considered a buyer's market by National Association of Realtors conventions, means less urgency to overbid, and more room to negotiate closing costs, rate buydowns or repairs.
Insurance and Flood Risk: The Coastal Squeeze
The coastal and river-adjacent cities on the list, Charleston, Myrtle Beach, Wilmington, Mount Pleasant and Asheville, face a different problem: it is not that nobody wants to buy, it is that the true cost of owning is rising faster than list prices suggest.
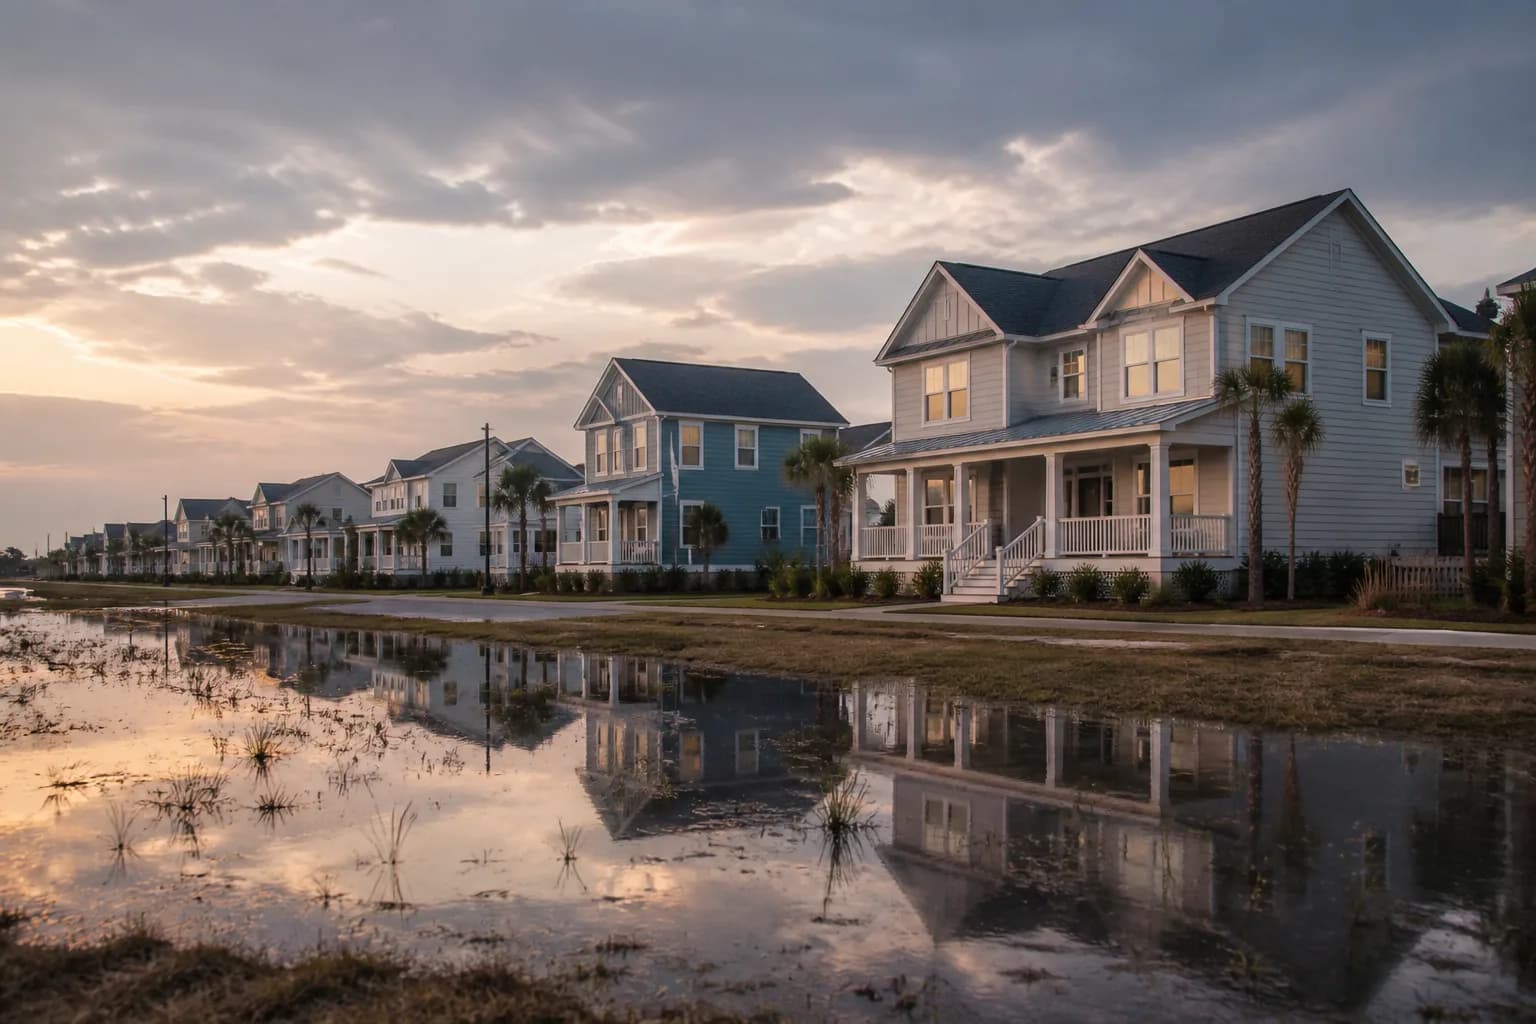
NOAA tide-gauge data has documented a long-term increase in high-tide nuisance flooding along much of the Southeast coast, and the video cites a claimed increase of more than 200 percent in tidal flooding events in Charleston since the year 2000. FEMA periodically updates its flood insurance rate maps, and when a property moves into a higher-risk zone, flood insurance becomes mandatory for federally backed mortgages, often adding thousands of dollars a year in cost. Homeowners considering a Florida purchase face a related dynamic; our piece on Florida Foreclosures Spike 300%: What's Driving the Surge in 2026 (https://ushousingreport.com/florida-foreclosures-spike-2026) covers how insurance and carrying-cost pressure can eventually push distressed owners into default.
For Myrtle Beach specifically, the video points to condo-association special assessments tied to tightened building-safety codes, a cost that can appear suddenly and is not reflected in a listing price. For Asheville, the aftermath of Hurricane Helene in September 2024 is still working through the market: insurers pulling back in landslide-prone areas, and buyer demand cooling in valley neighborhoods most exposed to flash flooding.
Price Softness: Where Momentum Has Already Reversed
Three cities in the video, Asheville, Mount Pleasant and Spartanburg, are described as having already posted outright year-over-year price declines of 18 percent, 12 percent and 22 percent respectively, per the video's figures. If accurate, that would put them well outside the range of a normal seasonal slowdown and closer to a genuine correction. Durham and Raleigh are described as being earlier in that cycle, with rising price-cut frequency rather than confirmed year-over-year declines yet.
It is worth noting that national data from sources like the National Association of Realtors and Freddie Mac's Primary Mortgage Market Survey show mortgage rates remaining a key affordability constraint nationwide in 2026, which compounds local oversupply. Buyers priced out by rate levels are less able to absorb excess inventory, regardless of the metro.
What This Means for You: Buyers, Sellers and Owners
If you are buying in one of these metros:
- Pull actual months-of-supply and price-cut data for the specific ZIP code, not just the metro, before writing an offer.
- Get a written insurance quote, not an estimate, before finalizing a purchase contract, especially within 10 miles of the coast or in a FEMA-mapped flood zone.
- Ask for HOA financial statements and reserve-study history on any condo or townhome, particularly buildings over 20 years old.
- In inland boomtowns, compare local wage data from the Census Bureau American Community Survey against the median list price to gauge how sustainable current pricing is.
If you already own in one of these areas:
- Check whether your property was recently reassessed; several counties named in the video, including Mecklenburg, Wake, Charleston and Durham, have executed valuation updates that raised tax bills independent of any sale.
- Shop your homeowners and flood policies annually; coastal premium increases have been uneven, and switching carriers can sometimes offset large hikes.
- If you are near retirement or planning to sell within 2 to 3 years, consider whether waiting out a possible oversupply period changes your net proceeds.
If you are selling:
- In markets with rising inventory, pricing at or slightly under recent comparable sales, rather than testing the top of the range, tends to reduce time on market.
- Be prepared to compete with builder incentives such as rate buydowns and closing-cost credits if there is active new construction nearby.
Where the Claims Need a Grain of Salt
TD World Canvas presents this list with strong, sometimes sensational language, and several figures, like a 99 percent requested insurance rate hike or a large equity loss framed for shock value, are attention-grabbing framing devices as much as they are data points. A few caveats:
- Many statistics are attributed to named sources such as CoreLogic, Redfin, Zillow, NOAA, FEMA and county tax offices, but were not independently verified for this article, and the video is auto-transcribed with no on-screen citations. Readers should confirm any figure against the primary source before relying on it.
- Requested insurance rate increases, like the cited North Carolina coastal filing, are not always the amount regulators ultimately approve.
- Year-over-year inventory swings of 55 to 180 percent often reflect a low starting base; a small number of listings can produce a large percentage jump without signaling a crisis.
- Not every buyer is exposed to these risks equally. A cash buyer purchasing well below the metro median, for example, faces less rate and resale risk than someone stretching to the top of an 800,000 dollar-plus price band.
For a broader look at how the mortgage financing backdrop is shaping affordability nationally in 2026, see our coverage of the mortgage origination collapse (https://ushousingreport.com/mortgage-origination-collapse-2027-outlook).
What to Watch Next
Keep an eye on three things over the next two quarters: local months-of-supply figures from your target metro's Realtor association, any FEMA flood-map updates scheduled for your county, and homeowners insurance filings with your state's department of insurance. Freddie Mac's weekly Primary Mortgage Market Survey and the National Association of Realtors' monthly existing-home sales report remain the best national benchmarks to check whether local softness is a Carolina-specific story or part of a broader national slowdown. [{"label": "NOAA Tides and Currents - High Tide Flooding", "url": "https://tidesandcurrents.noaa.gov/high-tide-flooding/", "kind": "reference"}, {"label": "FEMA Flood Map Service Center", "url": "https://msc.fema.gov/portal/home", "kind": "reference"}, {"label": "Freddie Mac Primary Mortgage Market Survey", "url": "https://www.freddiemac.com/pmms", "kind": "reference"}, {"label": "National Association of Realtors - Existing Home Sales", "url": "https://www.nar.realtor/research-and-statistics/housing-statistics/existing-home-sales", "kind": "reference"}, {"label": "U.S. Census Bureau - American Community Survey", "url": "https://www.census.gov/programs-surveys/acs", "kind": "reference"}, {"label": "Source video: TD World Canvas - Carolina housing risk 2026", "url": "https://www.youtube.com/watch?v=cQPxVHmohGU", "kind": "reference"}]